
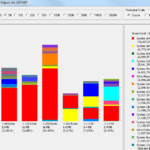
CLR Profiler can be used to analyse how your object is allocated in memory and which object has taken the most memory. It also can be used to detect memory leak
To download CLR profiler for .NET 2.0 please visit http://www.microsoft.com/download/en/details.aspx?id=13382 , there is another version for .NET framework 1.1
-Extract the file into your desired location
-you also need to run “regsvr32 ProfilerOBJ.dll” otherwise you will get dialog message that mentioned it’s waiting for the CLR and you will not get any result
– Run the CLRProfiler.exe in Binariesx86 if your app is 32 bit and Binariesx64 if your app is 64 bit
For profiling windows app, you can do the following steps:

1. Select the exe file
2. Do stuff/interact with your application
3. Once you are finished then you can close your application or select “Kill Application”
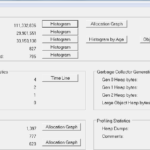
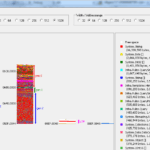
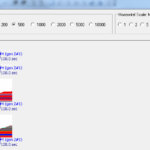
4. Upon completion it will give you the screen below
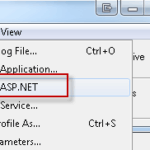
For profiling ASP.NET app, you can do the following steps:
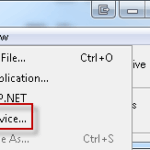
1. Select Profile ASP.NET from file menu
2. It will restart your IIS with the necessary trace
3. Select “Start ASP.NET”
4. Once you are finished then select “Kill ASP.NET”
5. It will restart the IIS and remove the trace added before
6. Upon completion it will give you the screen below
*You can use this for service as well –
-
- image0021
-
- image0031
-
- image0041
-
- image007
This is the information for GC
-
- image0051
-
- image0061
Leave a Reply